

력사를 찾아서
아메리카 - 길이만 12km..아마존 열대우림서 1만2000년 된 벽화 발견 본문

아마존 열대우림 외진 곳에서 약 1만2500년 된 벽화가 발견됐다.
2020년 11월 29일(현지시간) 영국 일간 가디언 일요판 옵서버에 따르면, 영국과 콜롬비아 공동 고고학 연구팀은 지난해 콜롬비아 치리비케테 국립공원의 한 절벽에서 인간과 동물을 형상화한 벽화를 발견했다.
이 선사시대 그림의 폭은 12.87㎞ 정도나 돼 발견 장소는 ‘고대인들의 시스티나 성당’으로도 불린다. 왜냐하면 시스티나 성당은 르네상스 시대 거장 미켈란젤로가 높이 20m의 천장에 그린 세계 최대 크기의 벽화로 유명하기 때문.
■ 길이만 12km..아마존 열대우림서 1만2000년 된 벽화 발견

길이만 12㎞…아마존 열대우림서 1만2000년 된 벽화 발견(사진=AFP 연합뉴스)
벽화는 그려진 시기가 적어도 1만2000년 전으로, 그동안 남아메리카 대륙에서 볼 수 없었던 코끼리의 선사시대 조상뻘인 마스토톤 등 빙하기에 멸종한 동물들을 보여준다. 낙타과의 멸종 동물 팔래올라마와 거대 나무늘보 그리고 빙하기 말뿐만 아니라 다른 선사시대 벽화들에서 볼 수 있었던 사람의 손바닥 자국들도 남아 있다.
아마존에 사는 대부분의 원주민 부족은 최대 1만7000년 전 베링 육교를 건넌 것으로 생각되는 첫 번째 시베리아 이주민들의 후손으로 여겨진다.
베링 육교는 플라이스토세의 빙하기에 해면이 저하돼 생겨난 시베리아와 알래스카 사이를 연결하는 육지로, 당시에는 강설량이 매우 적어 육로가 손상되지 않아 양 대륙으로 몇백 ㎞까지 뻗어 있어 사람들이 다른 지역으로 건너갈 수 있는 길을 제공했다.

벽화에는 고대인들의 손바닥 자국도 남아 있다.
벽화는 현재 어느 부족이 새겨놨는지 정확히 알 수 없지만, 아마존에는 지난 몇천 년 동안 존재해온 것으로 추정되는 두 주요 원주민 부족인 야노마미와 카야포가 있다.
브라질과 베네수엘라의 국경 사이 지역에서 거주하는 야노마미에 관한 최초 보고는 1759년 스페인의 한 탐험가가 발견한 다른 부족의 족장에게서 전해들은 이야기에서 나왔다. 반면 인구 8600명으로 추정되는 카야포족의 기원에 대해서는 훨씬 덜 알려졌다.
아마존의 원주민들은 비교적 최근까지 문자 기록을 남기지 않았고 그곳의 습한 기후와 산성 토양은 유골을 포함한 그들의 물질문화의 거의 모든 흔적을 지웠다. 이번 벽화가 발견되기 전까지 1500년 이전의 이 지역 역사에 대해 알려진 것은 도자기나 화살촉과 같이 거의 남지 않은 고고학적 증거에서 유추한 것이었다.
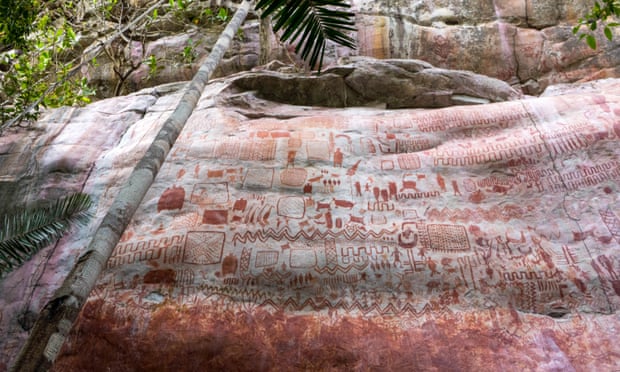
아마존 열대우림에서 발견된 고대 벽화의 일부 모습.
현재 사라진 문명을 엿볼 수도 있는 이번 고대 벽화는 역사상 최초로 아마존에 도달한 사람들에 의해 만들어진 것으로 여겨진다. 벽화가 발견된 장소는 세라니아 데 라 린도사라는 지역 안으로, 이곳은 너무 외진 곳이라서 연구팀은 차로 2시간을 이동한 뒤 거기서 다시 도보로 4시간을 걸어가야 했다.
연구팀 책임자인 호세 이리아르테 영국 엑서터대 고고학과 교수는 “우리는 몇만 점의 벽화에 대해 조사하고 있다”면서 “이를 문서화하는 데는 3세대가 걸릴 것”이라고 말했다. 또한 “이제 우리는 멸종 동물들을 살펴보기 시작했다. 이 그림들은 너무 자연스럽고 잘 묘사돼 있어 당신이 말을 보고 있다고 말해도 우리는 거의 의심하지 않는다”면서 “너무 세밀해서 말 털까지 볼 수 있다”고 설명했다.
벽화 중 일부는 비교적 깎아지른 암벽 위에 극도로 높게 그려져 있어 처음에 연구팀을 당황하게 했다. 하지만 이리아르테 교수는 벽화 중에 나무로 만든 탑을 묘사한 것을 발견하고 이것이 토착민들이 어떻게 이런 극한의 높이까지 올라갈 수 있었다고 생각한다.
또 벽화는 종교적 목적으로 그려졌는지 확실하지 않지만 연구팀은 벽화에서 많은 커다란 동물들이 마치 숭배되고 있는 것처럼 사람들이 팔을 들어올리고 둘러싸고 있는 모습을 발견했다.

아마존 열대우림에서 발견된 고대 벽화를 카메라에 담고 있는 채널4 다큐멘터리팀의 모습.(사진=엘라 알사마히)

고고학자 겸 탐험가 엘라 알샤마히의 모습.
지금까지 공개되지 않았던 이 벽화는 오는 12월 5일 영국 채널4 방송 다큐멘터리 ‘정글 미스터리: 아마존의 잃어버린 왕국’에서 자세히 다룰 예정이다. 이 프로그램의 진행자로 고고학자 겸 탐험가인 엘라 알샤마히는 “일부 사람은 아마존이 항상 열대우림이 아니었고 사실 몇천 년 전에는 훨씬 더 사바나 사막 같았다는 사실을 알지 못한다”면서 “이 땅이 그렇게 오래전에 어떻게 생겼을지에 관한 이 고대 벽화를 보는 것은 매우 흥미롭다”고 말했다.
이리아르테 교수는 앞으로 이 지역에서 더 많은 벽화를 발견할 것이라고 확신하고 있어 그와 그의 동료들은 코로나19 규제가 풀리는 대로 현장을 다시 방문해 조사할 계획인 것으로 전해졌다.(1)
아메리카 대륙에 사는 인디언들의 기원을 두고 학계의 연구가 이어지고 있는 가운데 인디언들의 조상을 러시아 바이칼호 주변에 살았던 고대인과 연결 짓는 흥미로운 연구 결과가 나왔다.
2020년 5월 23일 러시아 관영 타스 통신과 UPI 통신 등에 따르면 독일 막스 플랑크 인류 역사과학연구소와 러시아 과학아카데미, 모스크바국립대 등이 주축이 된 국제 연구진은 최근 이런 조사 결과를 저널 'CELL'에 게재했다.
■ "아메리카 인디언 조상, 극동 바이칼호 주변에 살았다"
김형우기자, 2020-05-23
연구진은 옛 소련 고고학자들이 1960∼70년대 러시아 극동 부랴티야 공화국 남쪽 우스티캬크타 지역에서 발견한 1만4천년 전 고대인의 치아에서 나온 DNA를 게놈(genome·유전체) 분석한 끝에 아메리카 대륙에 사는 인디언들과의 관계를 밝혀낼 수 있었다고 밝혔다.
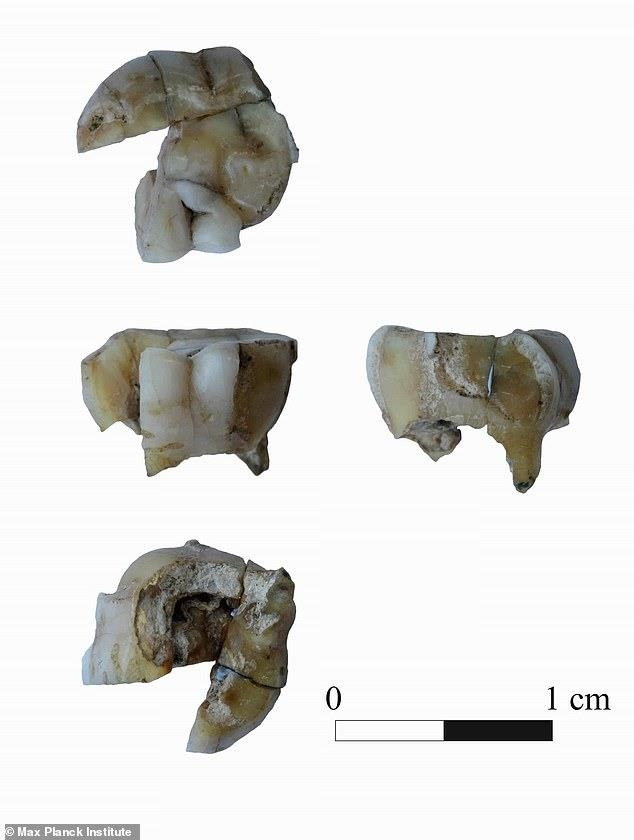
[막스 플랑크 인류역사과학연구소 홈페이지 캡처, 재배포 및 DB화 금지]
고대인의 치아에서 발견된 유전자는 아메리카에 있는 옛 원주민의 것과 상당히 유사했다.
독일 막스 플랑크 인류 역사과학연구소 생물학자인 허위는 UPI 통신에 "이번 연구에서 관찰된 상부 구석기 시베리아인(Upper Paleolithic Siberian)과 아메리카 원주민(First Americans)의 강력한 연결고리는 양쪽이 동일한 조상(same admixed ancestry)을 공유하고 있다는 점"이라고 밝혔다.
연구에 공동으로 참여했던 서울대학교 자연과학대학 생명과학부 정충원 조교수는 연합뉴스에 "이번 연구는 아메리카 원주민의 조상이 바이칼호 주변에 살았던 고대인이었을 수 있다는 가능성을 제시했다는 점에서 의미가 있다"고 설명했다.
연구팀은 또 일부 유골에서 흑사병의 원인균인 예르시니아 페티스(Yersinia petis)라는 세균이 발견됐다고도 했다.(2)
연합뉴스, 김형우기자, "아메리카 인디언 조상, 극동 바이칼호 주변에 살았다", 2020-05-23
인류가 13만 년 전에 이미 북미 대륙에 도달했을 가능성이 있다는 연구결과가 나왔다. 사실이라면 인류의 북미 이동 시점을 기존 정설보다 10만 년 이상 앞당기는 결과다.
2017년 4월 26일(현지시간) 미국 언론 등에 따르면 샌디에이고 자연사박물관 연구팀은 캘리포니아주 샌디에이고 교외에서 발견된 마스토돈(Mastodon, Mammut)의 화석을 분석해 이 같은 연구결과를 학술지 네이처에 수록했다.
■ "인류, 13만년전에 북미 도달 가능성"..기존 학설에 10만년 앞서

美연구팀, 13만 년 전 마스토돈 화석서 인류 흔적
마스토돈은 빙하기에 절멸한 고대 코끼리로, 이번 화석은 13만 년 전의 것으로 추정된다. 연구팀은 화석발굴 현장에서 태퇴뼈 파편과 더불어 무언가를 때리는 데 사용된 흔적이 남아있는 돌 등을 발견했다. 뼈 파편에서는 사람이 돌로 때려 부서진 것으로 보이는 흔적이나 인위적으로 내동댕이칠 때 생기는 갈라진 모습이 관찰됐다.
연구팀은 이를 토대로 사람이 마스토돈의 뼈를 깨고 속에 들어있던 골수 등을 먹거나 도구로 사용했을 가능성이 있다고 추정했다.
연구를 이끈 토마스 드메레 박사는 "암석에 박혀있는 마스토돈의 뼈와 상아 화석은 당시 캘리포니아 주에서도 인류의 조상이 활동했다는 증거"라며 "인류의 조상이 이곳에서 돌을 이용해 마스토돈의 뼈를 부쉈다는 가설이 성립된다"고 밝혔다.
스티브 홀렌 미국구석기연구센터 소장도 "암석에 뼈와 상아 화석이 발견됐다는 것은 손재주와 경험적 지식을 갖고 있던 인류가 활동했다는 증거가 될 수 있다"고 가세했다. 그러나 연구팀은 발굴현장에서 사람의 뼈나 돌그릇 등 당시 인류의 존재를 보여주는 명확한 증거를 발견하지는 못했다.

존 맥냅 사우스햄턴대 연구원은 "이 가설이 입증되면 미 대륙에서 첫 인류가 나타난 시기는 지금까지 알려진 것보다 10만 년 전을 거슬러 올라가는 것"이라고 말했다.
기존에는 현생 인류인 호모 사피엔스가 10만∼20만 년 전에 아프리카에서 처음 출현한 후 대이동해 약 1만5천 년 전에 미국 대륙에 도착한 것으로 추정돼 왔다.
이번 연구결과가 사실이라면 호모 사피엔스가 오기 전에 네안데르탈인이나 호모 에렉투스 등 다른 인류들이 먼저 북미 대륙을 밟았음을 의미하는 것이다.
그러나 전문가들 사이에서는 "근거가 충분치 않다"는 지적도 나오고 있다. 가이후 요스케 일본 국립박물관 인류사연구팀장은 "동물뼈의 부서진 모양이 인위적이라는 것만으로는 증거가 불충분하고 13만 년 전의 것이라는 연대측정에도 문제가 있을 가능성이 있다"고 지적하고 "사람의 뼈 등 더 강력한 증거가 필요하다"고 말했다.
또 "인류는 북시베리아를 통해 북미에 도달했을 것으로 추정되는데 그 연대에 시베리아로부터 북미대륙으로 건너갔다는 증거는 발견되지 않았기 때문에 즉시 학계의 지지를 받기는 어려울 것으로 본다"고 덧붙였다.
샌디에이고 카운티 고고학 장소는 1992년 고속도로 건설 작업 중 발견됐다. 지금까지 발굴을 통해 돌망치와 돌모루, 마스토돈 골격 화석 등이 발견됐다.(3)
서울·로스앤젤레스=연합뉴스, 이해영 기자, 김종우 특파원, "인류, 13만년전에 북미 도달 가능성"..기존 학설에 10만년 앞서, 2017. 4. 27.
오늘날 북미와 중남미를 통틀어 아메리카 대륙에 살고 있는 원주민의 대다수는 6명의 여성으로부터 퍼져 나왔으며 이들의 자손이 약2만년 전 아메리카 대륙에 도착한 것으로 밝혀졌다.
■ <과학> 美원주민 대부분은 6명의 여성 자손
미국 소렌슨분자유전학재단과 이탈리아 파도바 대학 연구진은 모계로만 전달되는 미토콘드리아 DNA 분석을 통해 오늘날 아메리카 원주민들의 가계도를 작성하고 각 계파별로 일어난 돌연변이의 빈도를 추적하는 방법으로 각 계파의 역사가 얼마나 오래 됐는지를 연구했다.
그 결과 미 원주민들의 모계 혈통은 모두 여섯 계파로 확인돼 기존 가설과 일치했으며 각 계파는 각기 단 한 명의 여성으로부터 퍼져나온 것으로 밝혀졌다.
그러나 이 연구는 아시아에서 북미대륙으로 건너온 이민들의 조상이 단 여섯명의 여성으로부터 퍼져 나왔음을 의미하는 것이 아니라 이들 여성의 특정 DNA가 오늘날 미 원주민의 95%에 남아 있음을 뜻하는 것이다.
또한 이들 여성이 생존한 시기가 같았을 것으로 보이지는 않으며 이들은 2만1천~1만8천년 전 사이에 아메리카 대륙에 도착했을 것으로 추측된다.
연구진은 이들 `시조모(始祖母)' 6명의 DNA 특징이 아시아에서는 발견되지 않는 것으로 보아 이들이 아시아에 살지는 않았던 것이 분명하며 이들은 아마도 지금은 베링해 밑으로 가라앉은 육교 지역 베링기아에 살았을 것으로 추측된다고 밝혔다.
이 연구는 미국립공공과학도서관 온라인 학술지 플러스 원에 발표됐다.(4)
<자료출처>
(1) 길이만 12km..아마존 열대우림서 1만2000년 된 벽화 발견 (daum.net) 2020. 11. 30.
(2) "아메리카 인디언 조상, 극동 바이칼호 주변에 살았다" | 연합뉴스 (yna.co.kr)2020-05-23
<참고자료>
크리스탈 두개골, 1만 2000년전에 만들어져…"어떻게 만들어졌는지 미확인" (chosun.com) 2013.08.11.
Ancient Siberian’s skeleton yields links to Europe and Native Americans | Ars Technica
Upper Palaeolithic Siberian genome reveals dual ancestry of Native Americans | Nature
'현생인류출현~1만년전 > (구)석기시대' 카테고리의 다른 글
| 만주와 한반도 - 3만9000년前 한반도 눈금돌… 10진법으로 발전해 동방에 퍼졌다 (10) | 2025.03.18 |
|---|---|
| 만주와 한반도 - 동굴 많은 한반도서 빙하기 견딘 인류, ‘동아시아 문명’ 창조하다 (2) | 2025.03.18 |
| 동남아시아 - 보르네오섬서 '가장 오래된' 5만년전 구상화 동굴벽화 발견 (5) | 2025.03.17 |
| 아시아 - 현생인류 몽골 이주 1만년 더 앞선 4만5천년 전 이뤄져 (12) | 2025.03.16 |
| 유럽 - 7만4000년 전 동굴벽화가 준 충격 (13) | 2025.03.16 |


